@hamednik Fair enough  It would be excellent if Hive could adjust its dashboard presentation of GPUs with 0 hashrate so to make a note of such GPUs at the top of the page where there are numbers of active/inactive miners and GPUs. Because, those are failing GPUs and we need some kind of presentation of that info on one screen. With several pages of miners on dashboard, you need to scroll up and down looking for a failing GPU.
In terms of (in)correctly showing failing GPU - please note (as I have mentioned before) your parsing of a log file is not sorting the result, so it sometimes starts with GPU0 (correctly) and sometimes with any other random GPUxx. Here, part of log file from hive agent where you can see that miner stats show 0 hashrate on GPU5 and 10 secs later on GPU4:
[Tue Jul 3 19:18:27 +04 2018] > {“method”:“stats”,“jsonrpc”:“2.0”,“id”:0,“params”:{“rig_id”:“xxx”,“passwd”:“yyy”,“miner”:“dstm”,“miner_stats”:{“hs”:[2.745,2.745,2.745,2.745,2.745,0,2.745,2.745,2.745,2.745,2.745,2.745,2.745],…
[Tue Jul 3 19:18:38 +04 2018] > {“method”:“stats”,“jsonrpc”:“2.0”,“id”:0,“params”:{“rig_id”:“xxx”,“passwd”:“yyy”,“miner”:“dstm”,“miner_stats”:{“hs”:[2.745,2.745,2.745,2.745,0,2.745,2.745,2.745,2.745,2.745,2.745,2.745,2.745],…
It is not such a big deal, since one can identify failing GPU by comparing temps and power usage among GPUs, but this is one small potential improvement that can be addressed…


 It would be excellent if Hive could adjust its dashboard presentation of GPUs with 0 hashrate so to make a note of such GPUs at the top of the page where there are numbers of active/inactive miners and GPUs. Because, those are failing GPUs and we need some kind of presentation of that info on one screen. With several pages of miners on dashboard, you need to scroll up and down looking for a failing GPU.
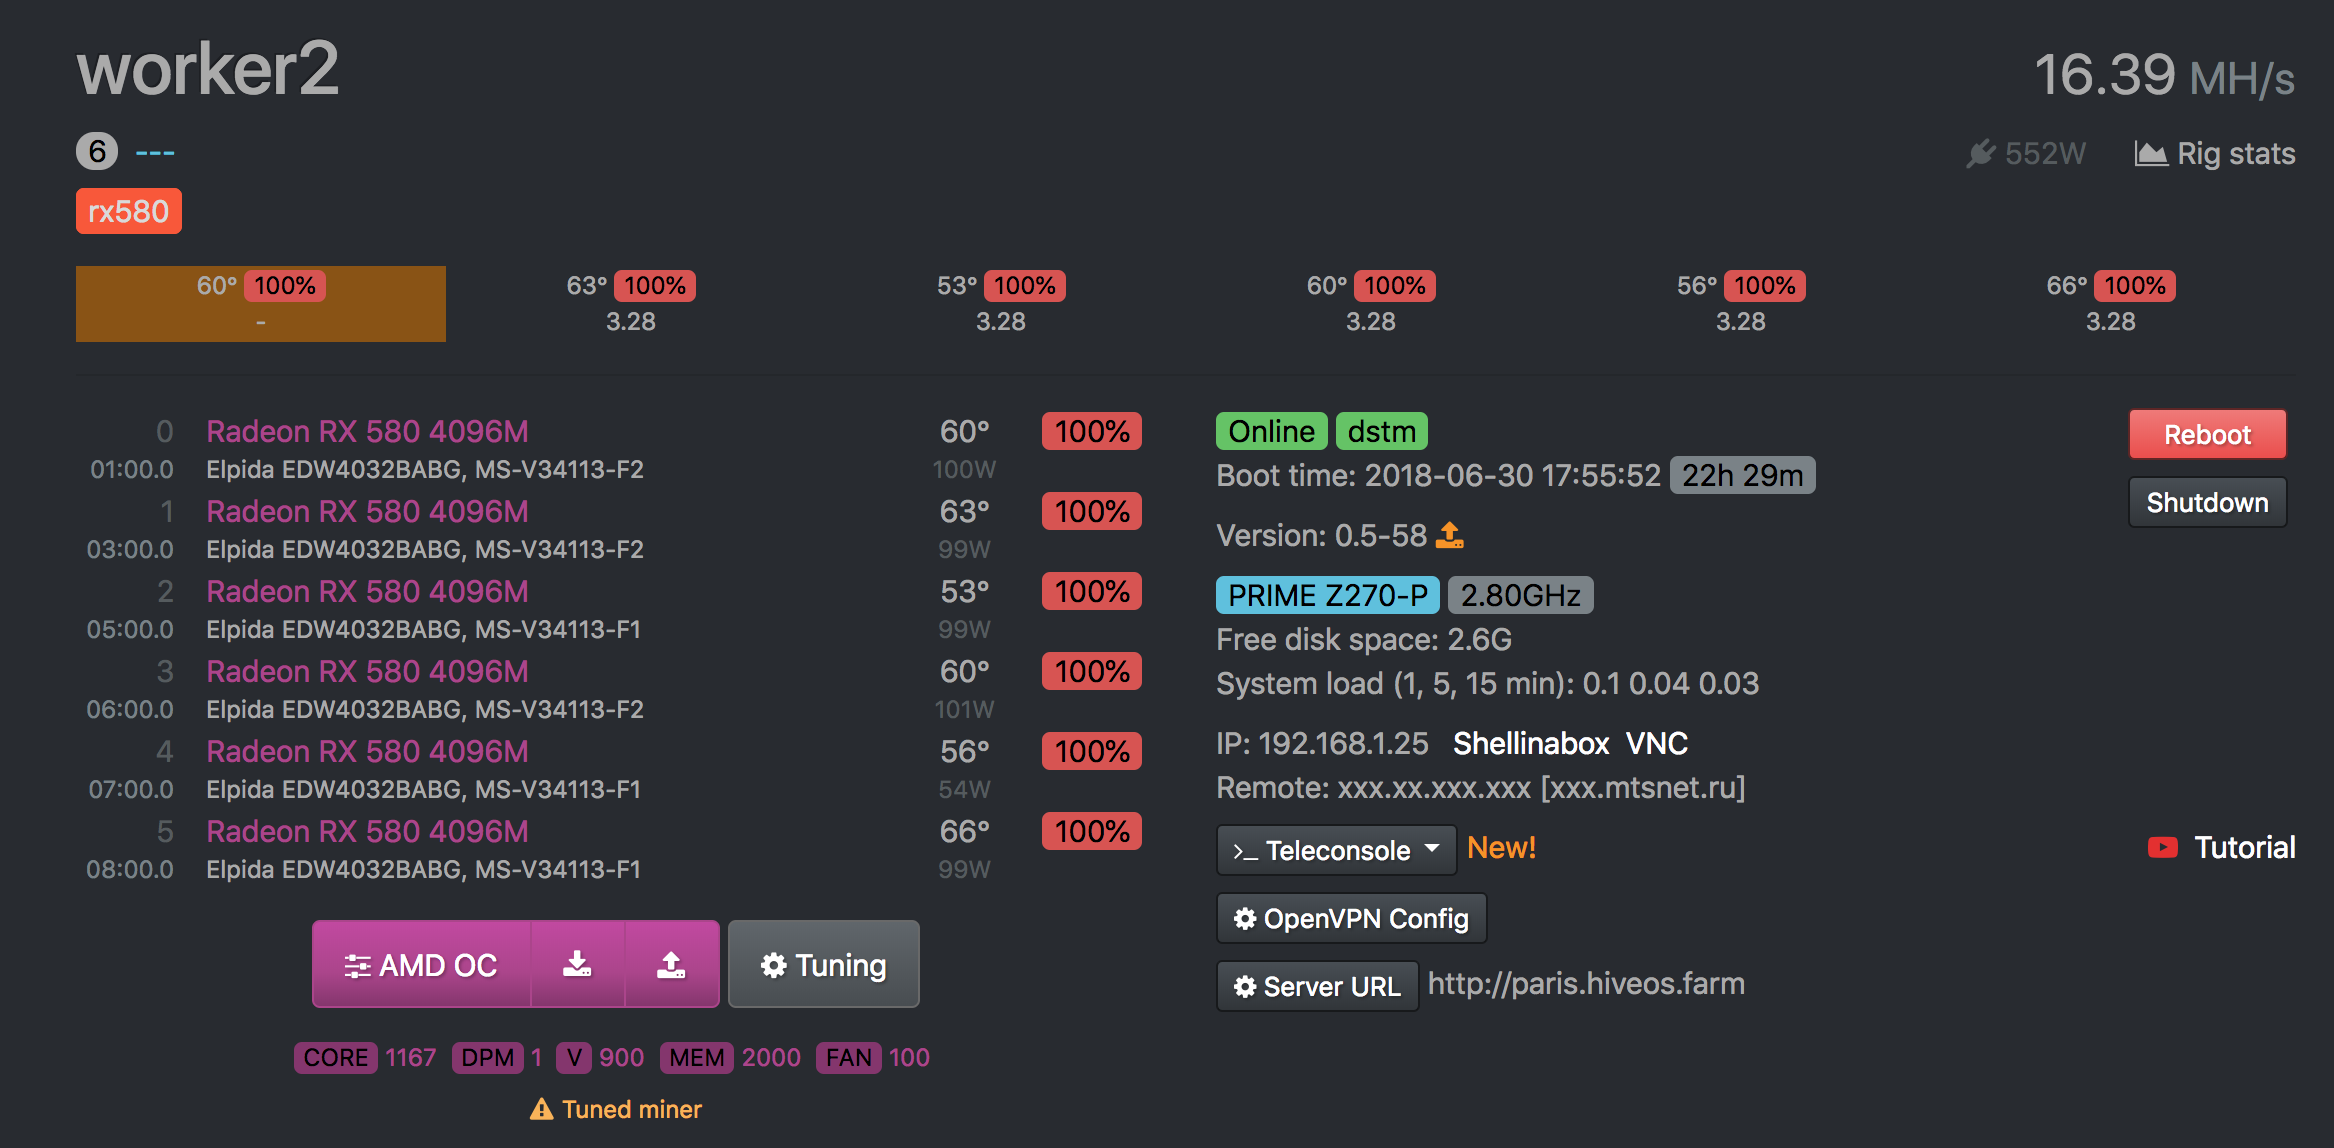